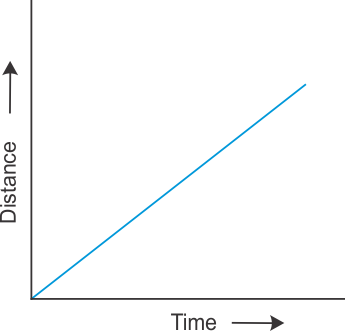
You can use a line graph that plots an object's distance versus its time to describe the object's motion.
Distance-Time Graphing
|
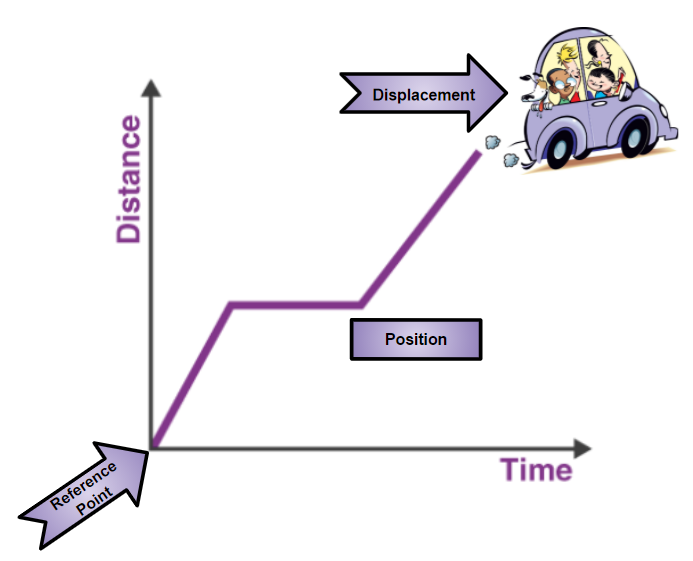
Distance-time graphs are used to show a change in an object’s location over time.
|
|
Position
- Position is the location of an object.
- An object changes position if it moves relative to a reference point (starting point).
- The change in position is determined by the distance and direction of an object’s change in position from the starting point (displacement).
- Direction is the line, or path along which something is moving, pointing, or aiming.
- Direction is measured using a reference point using terms such as up, down, left, right, forward, backward, toward, away from, north, south, east, or west.
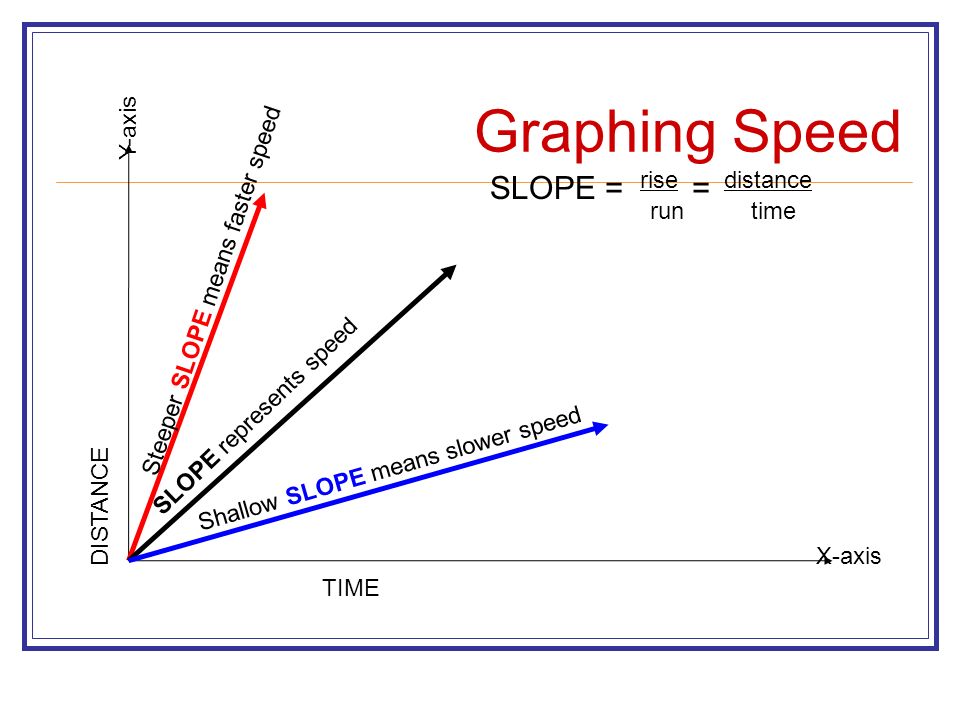
The Slope of the line Equals the Speed of the object
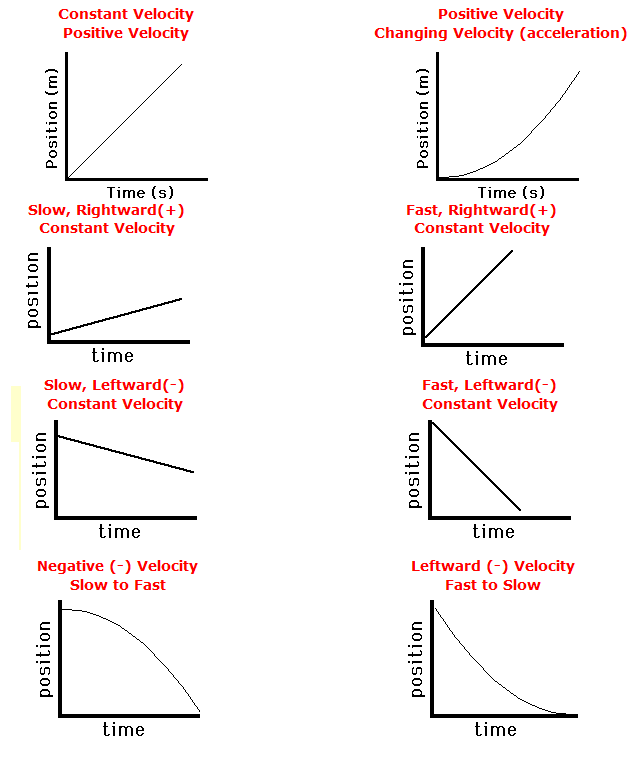
The slope (slant or angle) of the line can tell the speed of the object.
- When the slope of the line is steep, the speed is faster than if the slope were flatter.
- When the slope of the line is flatter, the speed is slower.
No Change in Slope Equals No Change in Speed
These two graphs are NOT increasing speed!
IMPORTANT! The slope of each line is constant therefore, the speeds are constant.
IMPORTANT! The slope of each line is constant therefore, the speeds are constant.
Steeper slope = faster constant speed
|
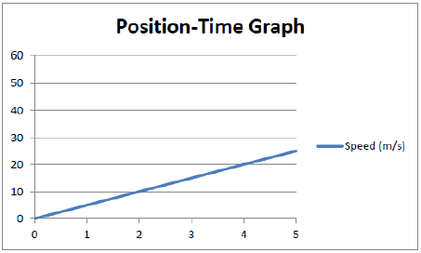
Flatter slope = slower constant speed
|
A Horizontal Slope Equals Zero constant Speed
When the slope of the line is horizontal to the x-axis, the speed is zero (the object is not moving).
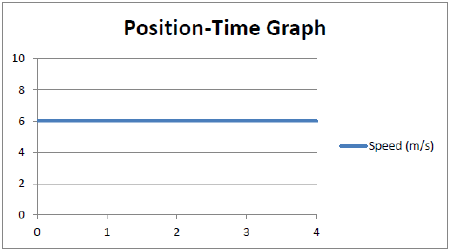
This object is not changing it's position over time. Therefore, it's speed is zero and is not in motion.
A Change in the Slope Equals a Change in Speed
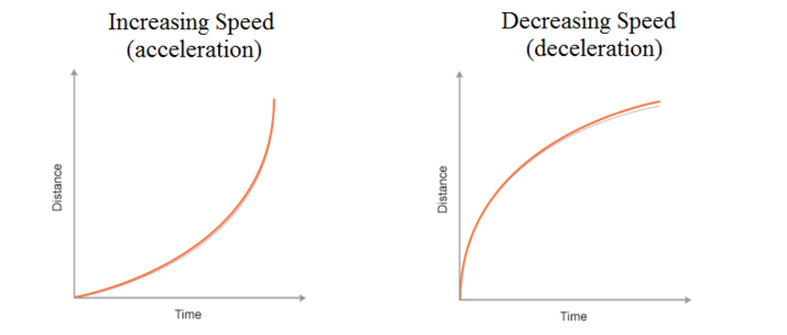
The slope of these two graphs are changing. Therefore, the objects are changing speed.
Graphing Motion Overview
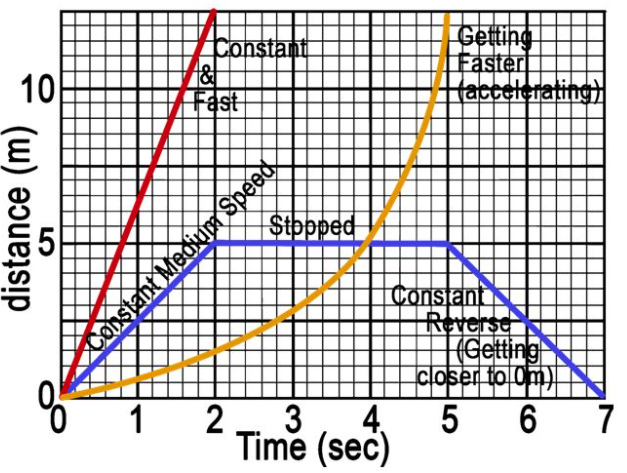
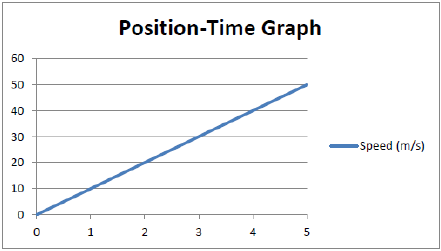
Important Position-Time Graph Examples
Calculating Average SpeedYou can determine an object's average speed using distance-time graphs.
|
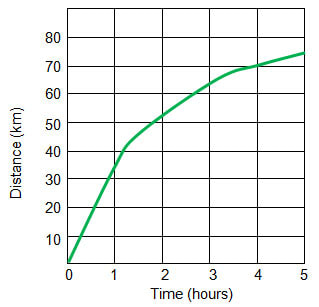
75 km divided by 5 hours = 15 km/hr
|

Learn about position, velocity, and acceleration graphs using this interactive. Move the little man back and forth with the mouse and plot his motion. Set the position, velocity, or acceleration and let the simulation move the man for you.
|
Video Guide:
|
|

Click Here to test your skills using different types of graphs to describe motion.
Topic Tips
- You can use a line graph that plots an object's distance versus its time to describe an object's motion.
- The steepness of a line is called the slope. Slope tells you how fast an object is moving.
- A constant slope equals a constant speed. A change in slope equals a change in speed.
|
|
|
